Chapter : Linear Equation in Two Variable
Graph of linear equation ax + by + c = 0 in two variables, where a and b not equal to zero
Graph of linear equation ax + by + c = 0 in two variables, where a ≠ and b ≠ 0
(i) Step I : To obtain the linear equation, let the equation be ax + by + c = 0.
(ii) Step II : Express y in terms of x to obtain –
y = – 
(iii) Step III : Give any two values to x and calculate the corresponding values of y from the expression in step II to obtain two solutions, say (α1, β1) and
(α2, β2). If possible take values of x as integers in such a manner that the corresponding values of y are also integers.
(iv) Step IV : Plot points (α1, β1) and (α2, β2) on a graph paper.
(v) Step V : Join the points marked in step IV to obtain a line. The line obtained is the graph of the equation ax + by + c = 0.
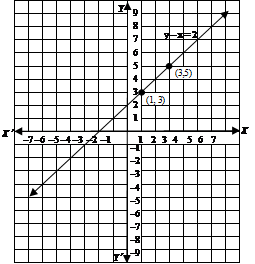
Example: Draw the graph of the equation y – x = 2.
Solution: We have, equation of linear equation is y – x = 2
⇒ y = x + 2
When we substitute x = 1 in given equation, we have : y = 1 + 2 = 3
When we substitute x = 3, we have : y = 3 + 2 = 5.
When we substitute x = 5, we have : y = 5 + 2 = 7.
Thus, we have the following table exhibiting the abscissa and ordinates of points on the line represented by the given equation.x1;35x357
Plotting the points (1, 3), (3, 5) and (5, 7) on the graph paper and drawing a line joining them, we obtain the graph of the line represented by the given equation as shown in given figure.

Example: Draw a graph of the line x – 2y = 3. From the graph, find the coordinates of the point when (i) x = – 5 (ii) y = 0.
Solution: We have x – 2y = 3 ⇒ y = (x – 3) /2
When x = 1, we have : y = (1 – 3)/2 = –1
When x = –1, we have : y = (–1 – 3)/2 = –2Thus, we have the following table :x1–1x–1–2
Plotting points (1, –1) & (–1, –2) on graph paper & joining them, we get straight line as shown in fig. This line is required graph of equation x – 2y = 3.

To find the coordinates of the point when x = –5, we draw a line parallel to y-axis and passing through (–5, 0). This line meets the graph of x – 2y = 3 at a point from which we draw a line parallel to x-axis which crosses y-axis at y = –4. So, the coordinates of the required point are (–5, –4).Since y = 0 on x-axis. So, the required point is the point where the line meets x-axis. From the graph the coordinates of such point are (3, 0).Hence, required points are (–5, –4) and (3, 0).
Trending Articles & Blogs
- Physics Tutor, Math Tutor Improve Your Child’s Knowledge
- How to Get Maximum Marks in Examination Preparation Strategy by Dr. Mukesh Shrimali
- 5 Important Tips To Personal Development Apply In Your Daily Life
- Breaking the Barriers Between High School and Higher Education
- 14 Vocational courses after class 12th
- Tips to Get Maximum Marks in Physics Examination
- Get Full Marks in Biology Class 12 CBSE
Download Old Sample Papers For Class X & XII
Download Practical Solutions of Chemistry and Physics for Class 12 with Solutions
Recent Questions Asked
- Newton’s laws of motion asked by Dr. Mukesh Shrimali
- Process of nutrition in Amoeba asked by Rajiv Sharma
- Importance of studying physics subject in school after 10th asked by Rajiv
- Refraction Through Prism in Different Medium asked by Kirti Sharma
- Ratio and Proportion Question asked by Education Desk
- Explain all the 12 tenses with example asked by Qwerty
- Refraction Through Prism in Different Medium asked by Seema Shrimali